As Black Friday and Cyber Monday (BFCM) approach, having an instant overview of your critical metrics is essential for navigating the holiday season effectively. That’s why we’re excited to unveil the BFCM Profit Navigator – a powerful, all-in-one dashboard designed to serve as your go-to resource for monitoring and maximizing profitability during this high-stakes period.
Whether you’re evaluating revenue streams, identifying top-performing products, or fine-tuning marketing strategies, the BFCM Profit Navigator gives you the insights you need to make impactful decisions. Let’s explore each section and highlight how the metrics empower you for BFCM success.
Why Do I Need This?
➡️ Boost ROAS by Prioritizing High-Margin Products
“Maximize Every Ad Dollar: Make Margin Count”
BFCM isn’t just about getting clicks – it’s about maximizing every cent of ad spend. Our approach prioritizes your highest-margin products on Meta and Google Ads, making each sale more profitable. By focusing on what drives revenue, you turn high-performing ads into your BFCM powerhouse, giving you an unbeatable ROAS during the biggest shopping days of the year.
➡️ Accelerate Slow Stock Turnover with Precision Targeting
“Clear Out Slow Stock, Boost Cash Flow”
When peak season hits, there’s no room for stagnation. Conjura targets slow-moving SKUs, accelerating turnover to reduce stock holding costs. Free up your cash flow, move you unsold inventory, and ensure every product earns its place during BFCM.
➡️ Increase Customer Lifetime Value by Promoting High-Impact Products on Effective Channels
“Turn Buyers into Lifelong Fans with Every Click”
During BFCM, a one-time purchase is just the beginning. Conjura pinpoints your highest-impact products and showcases them on the channels that drive conversions, increasing Customer Lifetime Value. By connecting customers to what they’ll love, you’re setting the stage for repeat purchases and loyalty that lasts far beyond BFCM.
Date Range
Starting today, leverage last year’s data to identify winning products and campaigns, setting a strong foundation for your 2024 peak season strategy. As of November 23rd, the dashboard will focus on current BFCM data, providing you with real-time, day-by-day insights through December 5th. Use this powerful dashboard to adapt quickly, maximize revenue and achieve your BFCM goals!
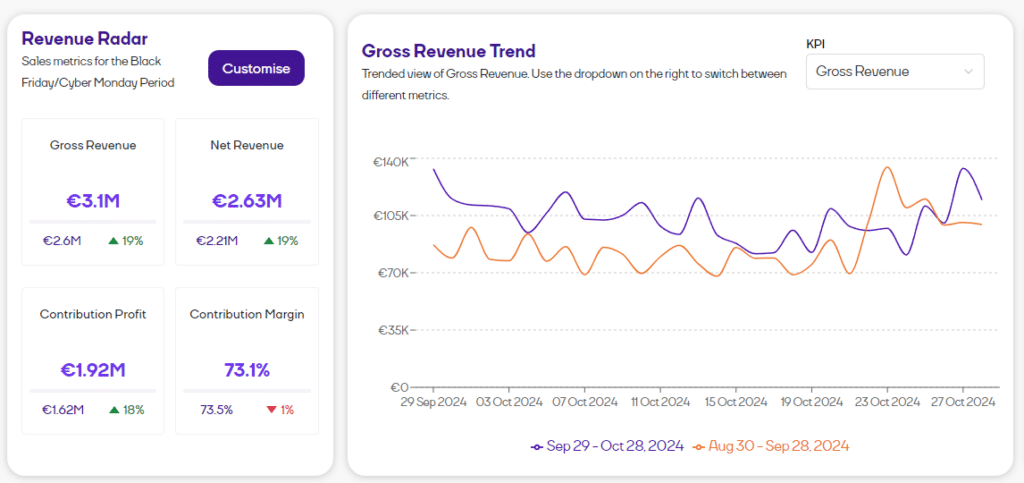
Revenue Radar
The BFCM Profit Navigator begins with a high-level revenue summary, providing you with key performance indicators to understand your financial health at a glance.
- Gross Revenue & Net Revenue: Instantly measure total revenue alongside net profits.
- Contribution Profit & Contribution Margin: Track how you’re operating after deducting variable costs from your sales revenue.
- Gross Revenue Trend Graph: See revenue changes over time to stay informed on performance shifts.
Product Hub
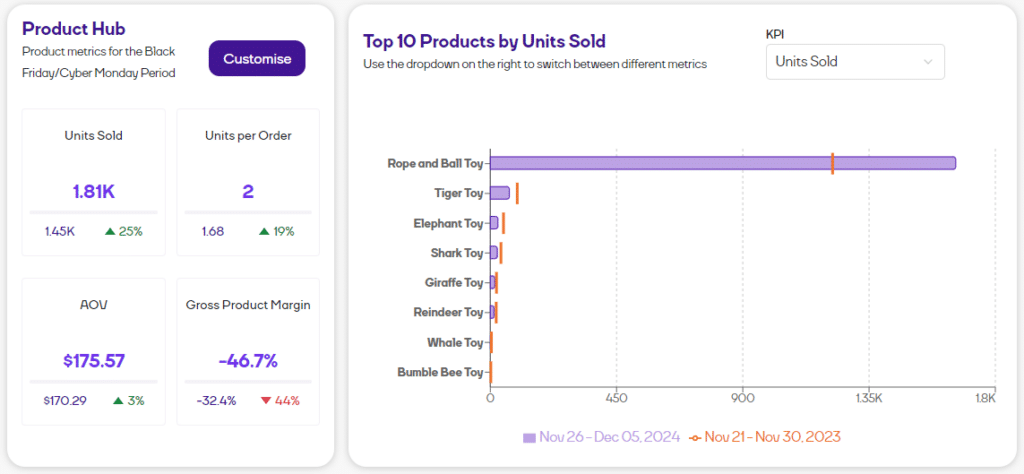
This card dives into essential product-level metrics to help you grasp your product catalog’s overall performance.
- Units Sold: See how many units have been sold across the product catalog.
- Units per Order: Understand the average number of units customers purchase per order – great for spotting trends and optimizing promotions.
- Average Order Value (AOV): Analyze the average spend per order, which can signal customer purchasing behavior and highlight opportunities for upselling.
- Gross Product Margin: Gauge product profitability by viewing gross margin per product, helping you prioritize products that contribute most to profit.
- Top 10 Products Bar Chart: This graph displays the top 10 products by units sold for the selected date range, helping you visualize which items are in highest demand over time. Use this data to spot rising trends and determine where to focus inventory and marketing efforts.
Product Table
This section offers a product-by-product analysis, helping you spotlight both star performers and hidden profitable items within your inventory. Delve into detailed metrics on each product, making it easy to adjust pricing or marketing and discover profitable yet underutilized products to potentially prioritize for BFCM.
Marketing Powerhouse
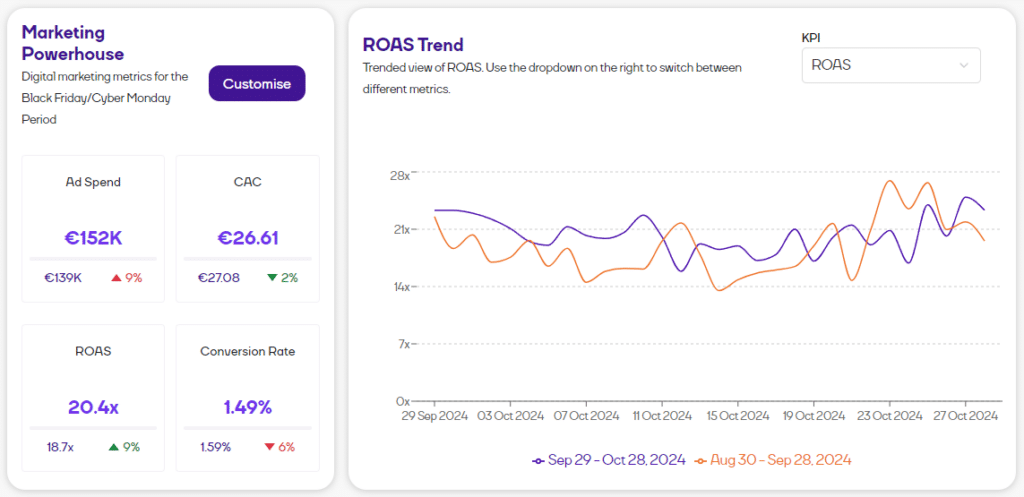
In the fast-paced BFCM season, knowing your ad spend, acquisition costs, and returns on each campaign is crucial. This section in the BFCM Profit Navigator provides a snapshot of your marketing impact.
- Ad Spend & Customer Acquisition Cost (CAC): Monitor ad spend and ensure your customer acquisition costs are on track.
- Return on Ad Spend (ROAS): Quickly see which campaigns generate the highest return on investment.
- Conversion Rate: Assess how effectively visitors convert to paying customers.
- ROAS Trend Line Graph: Visualize how ROAS evolves across campaigns and identify trends worth capitalizing on.
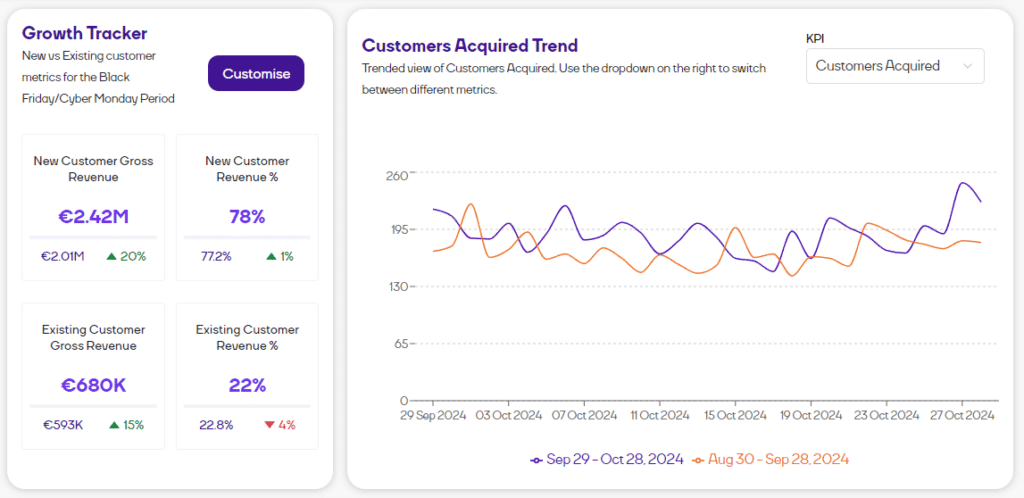
Growth Tracker
Understanding new versus existing customer contributions is vital for balancing growth and retention strategies during BFCM. This section breaks down revenue from both groups to inform your strategy.
- New Customer Gross Revenue & Revenue %: See how much revenue stems from new customers, critical for driving growth.
- Existing Customer Gross Revenue & Revenue %: Gauge loyalty with insights into repeat customer purchases.
- Customer Acquisition Trend Graph: Observe new customer trends and pinpoint BFCM’s most impactful days.
Marketing Breakdown
Rounding out the BFCM Profit Navigator is a campaign-level view of your highest-performing marketing efforts. This section provides a deeper look into the profitability of individual campaigns. Compare metrics like contribution profit, margin, and ad spend across campaigns and identify high-impact campaigns to allocate resources strategically.
With the BFCM Profit Navigator, you have a complete, streamlined view of the essential metrics for Black Friday and Cyber Monday success. Designed to bring together revenue, product, and marketing insights, this dashboard equips you to make data-driven decisions and optimize your holiday strategy. Get ready to boost profitability and uncover valuable insights, your ultimate tool for a successful BFCM season.
