
You’ve got an amazing eCommerce business, but how does your team take it to the next level and outgrow your competitors? By leveraging the goldmine of actionable data that sits within your eCom Store (Shopify, BigCommerce), ERP (Brightpearl), Marketplace tools (Linnworks), ads platforms (Google, Meta) and much more.
For modern eCommerce teams, understanding how to harness the right insights from an eCommerce analytics platform can mean the difference between thriving and simply surviving.
From founders to marketers, merchandisers to agencies – everyone’s decisions should be grounded in accurate eCommerce data. But with hundreds of metrics available, how do you know which ones matter most?
That’s exactly what we set out to explore.
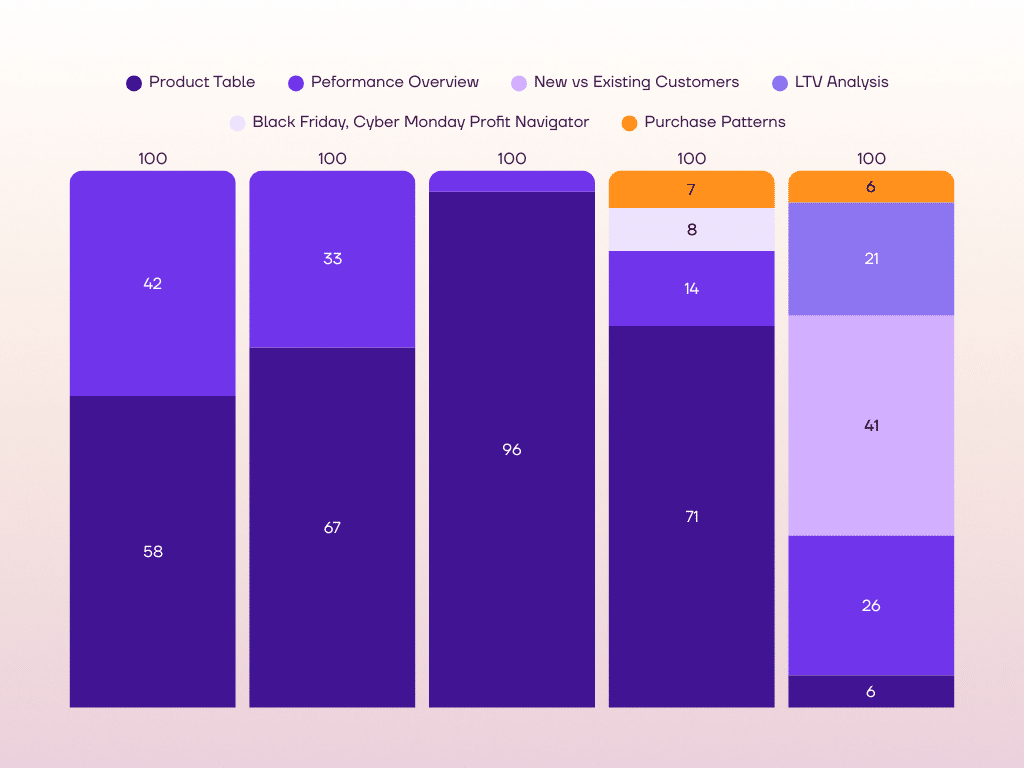
At Conjura, we analysed how different eCommerce professionals use our platform day to day. By grouping users based on job function and title, we uncovered patterns in dashboard usage, common KPIs, and key differences in how teams across a business leverage eCommerce analytics to drive performance.
The result? A practical playbook showing how high-performing eCommerce teams can use data (and the Conjura platform) to level up their marketing, sharpen their product performance strategy, and streamline stock optimization.
Let’s dive in!
Why eCommerce Analytics Matters More Than Ever
Running a successful eCommerce business means juggling multiple priorities – customer acquisition, order fulfilment, pricing, promotions, and inventory management. Each of these areas generates mountains of eCommerce data, but few teams are set up to extract value from it all.
That’s where an eCommerce analytics platform comes in.
A modern analytics platform like Conjura pulls together all your marketing, sales, product and operations data in one place, then turns it into insights your teams can actually use. No more guesswork. No more siloed spreadsheets (I mean, you never liked those pesky Excel docs anyway, did you?).
The beauty of Conjura is its versatility: different teams across the business can customise dashboards, filter by key metrics, and use product-level data to drive smarter decisions.
Here’s how real teams use Conjura to turn insight into action.
How Ecommerce Teams Use Conjura
1. Founders & CEOs: Strategic Oversight and Profitability
Focus: High-level profitability, top-line performance
Key Dashboards: Performance Overview, Product Table
Founders and CEOs aren’t buried in the weeds, they need a strategic snapshot of the business. The Performance Overview dashboard delivers a bird’s-eye view of key indicators like revenue, contribution profit, ROAS, and customer acquisition.
They also keep an eye on the Product Table to understand which SKUs are pulling their weight and which ones are eroding margin. With real-time visibility into stock levels, ad spend, and returns, leaders can make bold, data-driven moves without second-guessing.Quick insight: CEOs love our daily email digests that summarize yesterday’s key performance trends, giving them immediate visibility into how the business is doing.
2. Finance Teams: Monitoring Margins and ROI
Focus: Profitability, ROI, cost control
Key Dashboard: Performance Overview
Finance teams are laser-focused on the bottom line. With Conjura, they can track gross revenue, contribution margin, ad spend, and refund rates – all in one place. The Performance Overview dashboard allows them to assess return on investment (ROI), budget allocation, and campaign profitability with precision.
Thanks to SKU-level eCommerce analytics, finance leaders can drill into where costs are creeping and where profitability is thriving. That’s critical for forecasting, planning, and ensuring capital is deployed wisely.
3. Marketing Teams: Smarter Campaigns and Conversion Insights
Focus: Customer acquisition, campaign effectiveness, ROI
Key Dashboards: Product Table, Performance Trends
Marketers often live in fragmented platforms – jumping between Meta, Google Ads, and GA4. Conjura centralizes that chaos into a unified view of performance.
The Product Table is a marketer’s best friend. It ties ad spend directly to SKUs, showing conversion rates, product views, ROAS, and more. Meanwhile, the Performance Trends dashboard reveals how acquisition efforts are translating into long-term value.
Additionally, Conjura’s new Customer Table dashboard allows marketers to create bespoke customer segments based on trends/behaviour, such as high return rate and high value customers. Marketers can then export these lists and import them into a CRM for targeted outbound marketing campaigns.Bonus: Marketers can segment data by channel, territory, customer type (and much more) to pinpoint the most efficient acquisition strategies. Read about how Naturecan used influencer data to fuel expansion here.

4. Merchandising Teams: Elevating Product Performance
Focus: Product performance, pricing, promotions, stock optimization
Key Dashboard: Product Table
Merchandisers are responsible for making sure the right products are in front of the right customers at the right price. With Conjura’s Product Table, they can track how each SKU performs in terms of revenue, margin, conversion rate, and inventory.
Whether it’s spotting rising stars or flagging slow-movers, merchandisers use eCommerce analytics to guide promotions, markdowns, and stock replenishment (avoid costly over- and understocking!). Conjura also supports custom filtering, letting users zero in on product categories, geographies, or customer cohorts.
And for brands managing seasonal or trend-driven products, that level of granularity is gold.

5. Operations Teams: Efficiency Meets Insight
Focus: Fulfilment, logistics, supply chain
Key Dashboard: Product Table
Operations leaders use Conjura to optimize fulfilment and control costs. By analyzing SKU-level performance, they gain visibility into unit costs, stock levels, and sell-through rates.
Want to know which products are sitting in your warehouse too long? Conjura highlights overstocked items and helps pinpoint why. Perhaps the product isn’t converting. Or maybe you’re running ads on out-of-stock SKUs. Either way, our insights help operations avoid unnecessary holding costs and improve supply chain decisions.
This is where stock optimization truly happens – backed by data, not gut instinct.
6. Trading Teams: Pricing, Promotions, and Customer Behavior
Focus: Customer value, pricing optimization, behavioural trends
Key Dashboards: LTV Analysis, New vs. Existing Customers
Trading teams need to understand customer value over time to refine pricing and promotional strategies. With Conjura’s LTV Analysis, they can measure customer lifetime value (LTV), CAC, and repeat rates by cohort, product, or channel.
The New vs. Existing Customers dashboard helps track behavioural shifts. Are new customers discount-hungry? Are returning shoppers driving revenue? With these insights, traders can tailor campaigns and pricing models to maximize both acquisition and retention.

7. Agencies: Optimising Client Performance
Focus: Campaign performance, client ROI
Key Dashboards: Product Table, LTV Analysis
Agencies managing multiple clients need clear, actionable insights – fast! Conjura provides a consolidated view of how each brand is performing, which campaigns are working, and where to optimise next.
The Product Table allows agencies to measure SKU-level profitability and channel performance, while LTV Analysis informs customer targeting and retention strategies. By combining these insights, agencies can offer data-driven recommendations that drive real results and client satisfaction.

Why It Works: Customisable Dashboards for Every Role
At the heart of Conjura’s power is flexibility.
Every dashboard is customisable to fit the needs of the user. Want to view just high-margin SKUs with low stock cover? No problem. Need to compare campaign ROI across territories? Easy. Want to create daily reports filtered by brand or category? Done.
This empowers eCommerce teams to tailor their views to what matters most…no more one-size-fits-all reporting.
Unified eCommerce Data That Drives Unified Action
Whether you’re leading strategy from the top, running high-stakes ad campaigns, or fine-tuning stock levels, one thing is certain: real-time eCommerce analytics are the secret weapon of modern eCommerce success.
By putting eCommerce data at the heart of every decision, teams across your business – from marketing and operations to finance and merchandising – can drive higher profits, stronger campaigns, and smarter inventory decisions.
In short: better data means better decisions.
Ready to turn your eCommerce data into profit?
Book a demo with Conjura today and see how unified, actionable eCommerce analytics can transform how your team fuels business growth.
***
No matter your role, data-driven decisions are the key to ecommerce success. Conjura ensures that every team—whether in the C-Suite, Marketing, Merchandising, Operations, Trading, or Agency side—has the insights needed to drive growth and profitability.
Photo by olia danilevich: