


Product Deepdive Dashboard Features 👕
Track lifetime revenue and profit by cohort, analyze what’s driving value, and focus your acquisition and retention efforts where they’ll make the biggest impact.
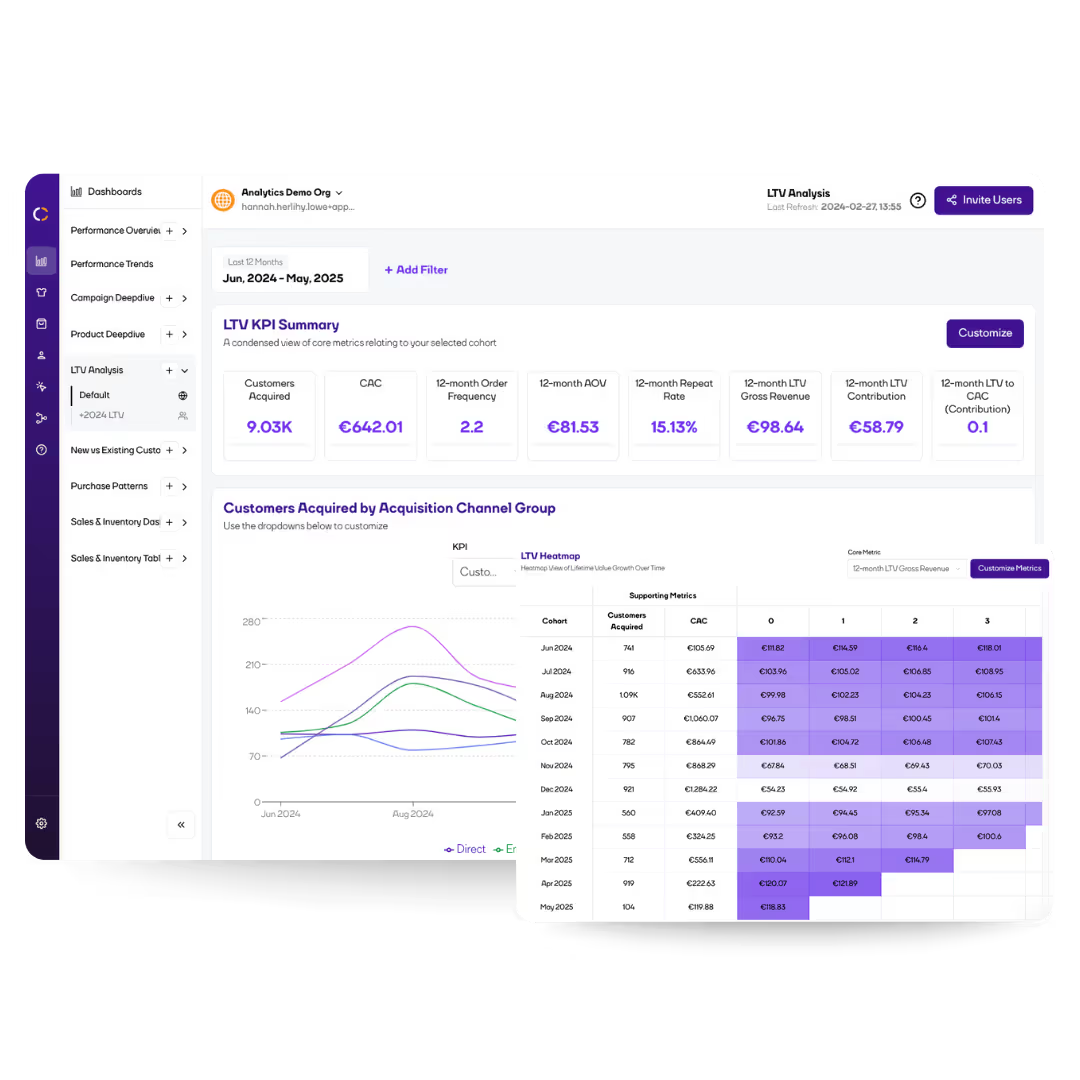
LTV Analysis Dashboard

.avif)


plans
Get Started
plans
LTV Analysis Dashboard Features 💸
The LTV Analysis dashboard goes beyond top-line numbers. It shows you how customer value grows over time and what’s driving that growth, using powerful cohort-based insights. Whether you’re trying to figure out how to calculate LTV of a customer or optimize your acquisition strategy, this dashboard gives you everything you need to do it right.
Visualized in a dynamic heatmap, LTV Analysis reveals cohort trends, lifecycle behaviours, and seasonal patterns. You’ll also get unique KPIs like Cohort AOV, Repeat Rate, and Order Frequency - so you can tell whether high LTV comes from loyal returners, frequent buyers, or big spenders.

See how customer lifetime value evolves over time using a colour-coded heatmap. Quickly spot trends, anomalies, and standout acquisition periods.

Use supporting metrics like Cohort AOV, Repeat Rate and Order Frequency to understand how different groups of customers generate value.

Evaluate how much you’re spending to acquire customers, what you’re getting in return and how long it takes to get that return. Break it down by cohort, country, product or channel.
Drill into your data by acquisition channel, brand, SKU, or region to pinpoint your most profitable customer segments.

Use customer lifecycle trends to refine your retention strategy, improve payback periods, and prioritize the highest-value channels.

Identify which campaigns, products or territories drive your most profitable customers and double down with confidence.
plans
Get Started
plans
Conjura Overview
SKU level insights
Understand true product performance
Customizable views
Pre-saved views allow you to see the metrics that matter

Complete clarity
Unify all your data into one easy-to-use platform
Insights to action
Intelligent suggestions that drive profit

plans
Get Started
Customer Stories
plans
Increased CAGR
Thanks to realtime accountability of KPIs across multiple teams.
AOV Increase YoY
With the help of Conjura's Product Dashboards.
.avif)
Conjura has given us real-time accountability across our teams. The Product Dashboard has really transformed our merchandising and marketing strategies."

Dessi Bell
CEO @ Saint and Sofia
Book A Demo
Book a demo with one of our team to discover the power of Conjura and how it can transform your business.
Revenue Increase
"I’m a big fan of Conjura and there’s so much more for us to keep getting from it.”
Kayla Wilson, Marketing Director @ Furniturebox

Explore the
Platform

faq
Here are some of the common questions our team receives. If you can't see what you're looking for then reach out to us via email or book a demo.
How quickly can I start seeing insights from Conjura?
What eCommerce platforms does Conjura integrate with?
Can Conjura help reduce my Customer Aquisition Cost (CAC)?
Can I customize dashboards to see the metrics that matter to my business?
Does Conjura present actionable insights?
Explore
Conjura


Unlock eCommerce performance data and gain insights that drive profit.
